January 1, 2026
 |
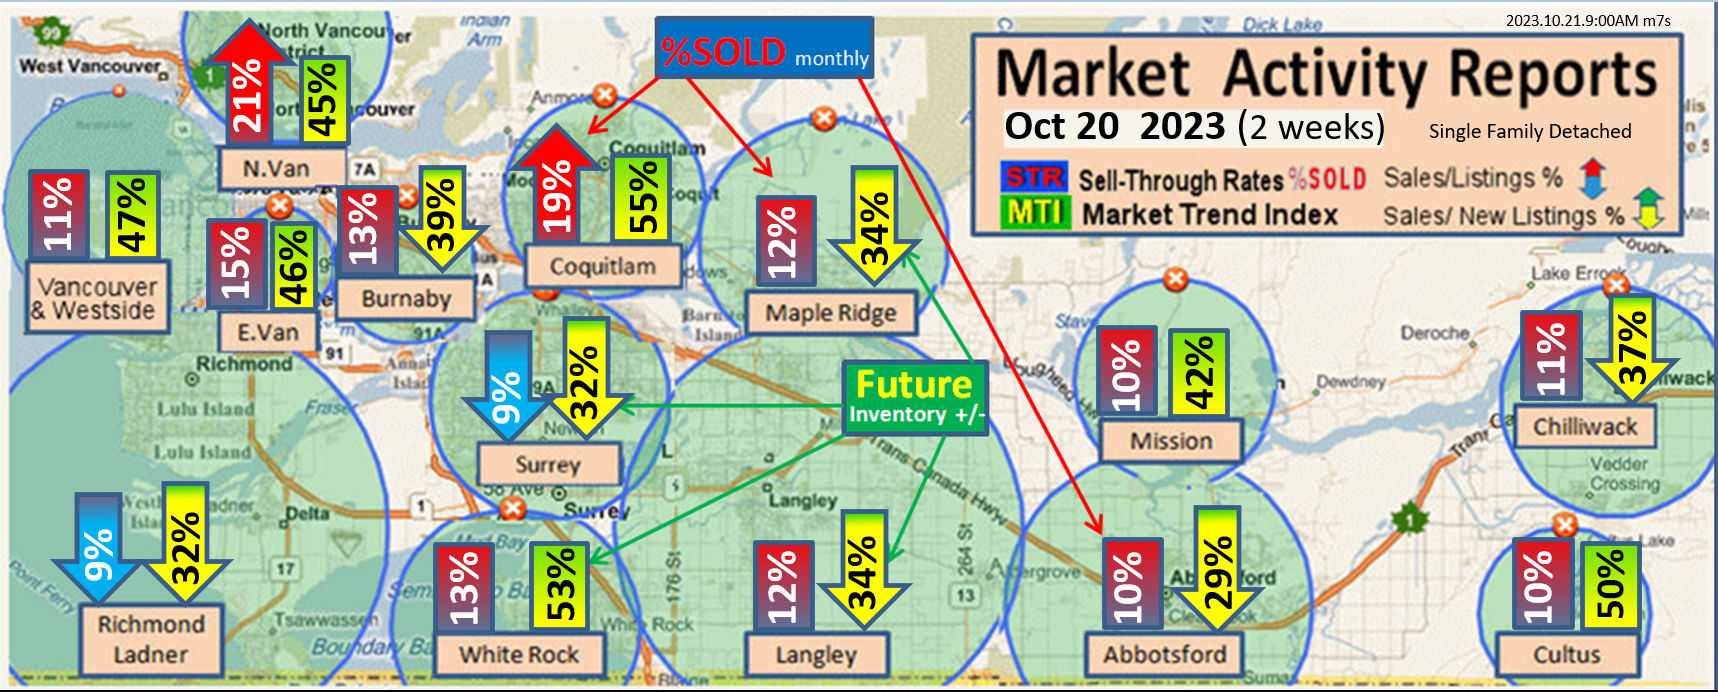
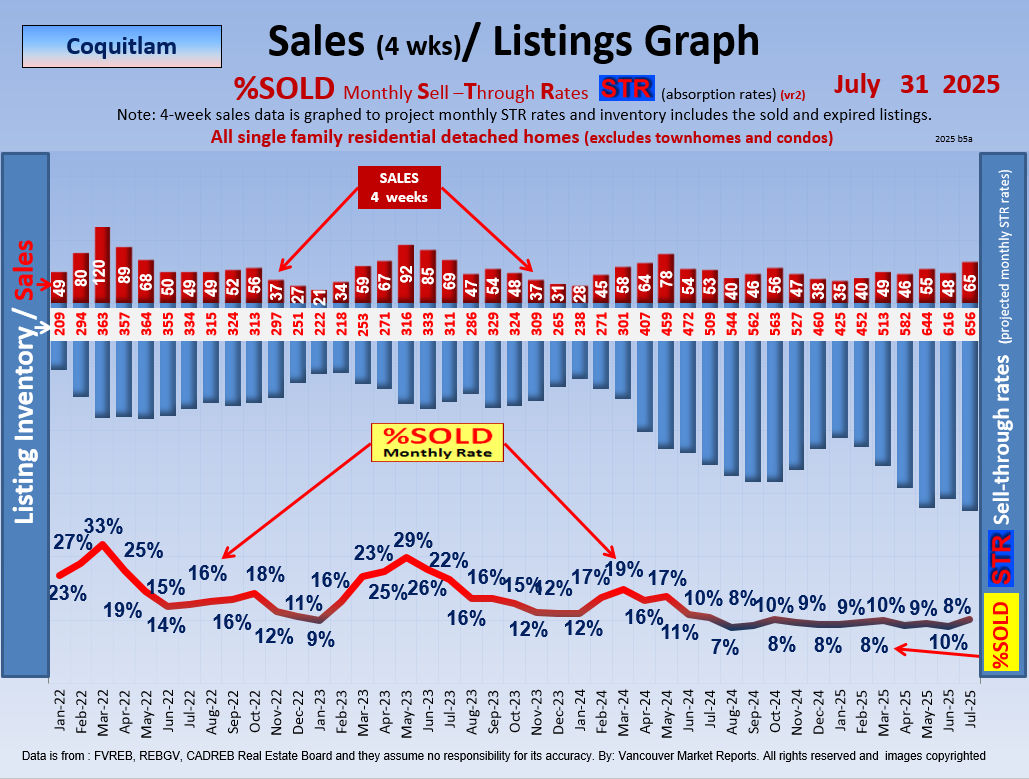
Current: Coquitlam's 10 %SOLD Rate indicates a Stable Market.
(This means 10 homes out of 100 sold last month with an Average $101,000 Discount from the Original List Price)
Most Active Range: Homes between$1.45 mill. - $1.7 mill. have a 19.6 %SOLD rate.
Least Active Range: Homes above $2.5 mill. have 4.7 %SOLD rate.
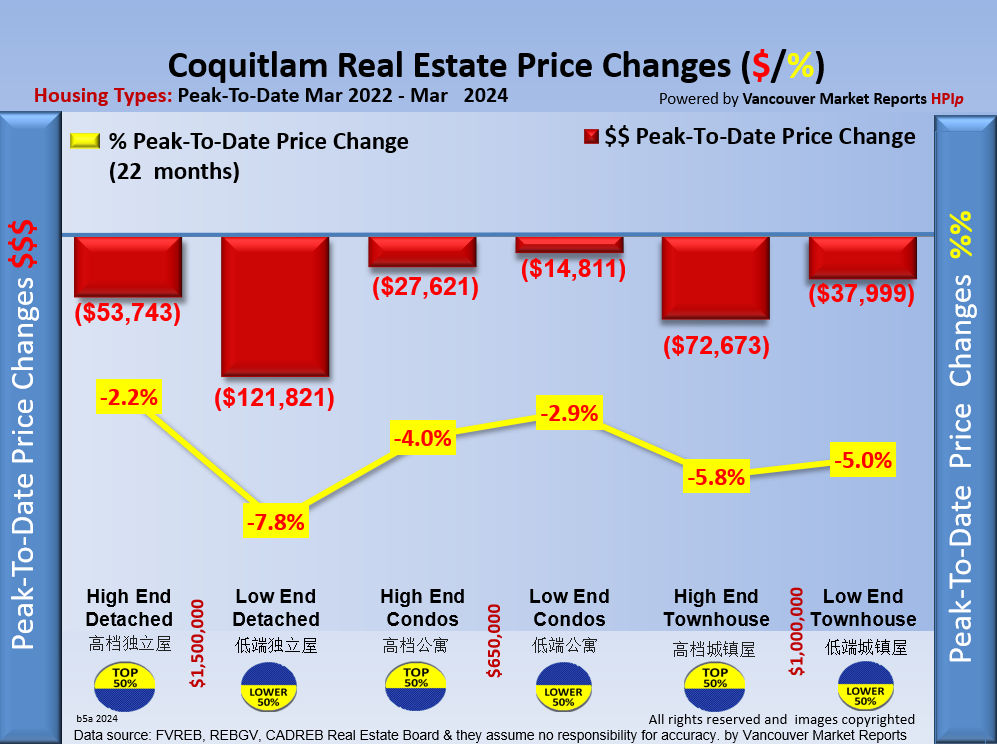
History: The Coquitlam Year-To-Date Home Price Index HPIp (Top 50%) shows that prices decreased $182,283.
The Coquitlam Year-To-Date Home Price Index HPIp (Lower 50%) shows that prices decreased $110,411.
*The HPIp (Home Price Index) is an approximate reflection of the Average Home Price Changes.
Forecast: Coquitlam has a normal Listing supply;325 homes are for sale. With the 10 %SOLD Monthly Rate (STR) gives us ~10, months of inventory. 3% of the Active Listings have reduced their price by $81,918 on Average or $52,000 Median. We project Coquitlam Detached now in a Stable Market
Greater Vancouver December 2025:
The market continues to cool, and buyers are firmly in control. In December 2025, about 86% of single-family homes lost value across Greater Metro Vancouver. The average price dropped $21,298, which is a slight improvement from November’s sharper $23,410 drop. Sales remained slow due to affordability pressures, economic uncertainty, and high inventory levels. Apartments and attached homes saw the largest price declines, leading the market downward.
Condos faced an even more challenging month, with 67% losing value and average prices dropping by $4,843. Townhome values were unchanged, posting the same $6,010 decline as in December. With trade negotiations and tariff concerns still in the spotlight, prices for condos and townhouses, we are forecasting that these lower prices could help set the stage for a modest rebound in sales in 2026 and stabilizing the market in the next 3 months.
The positive takeaway? Conditions strongly favor buyers right now. Sellers, however, will need a well-planned strategy to achieve the best possible value.
Wondering which neighbourhoods are gaining momentum—or slowing? Visit VancouverMarketReports.com every Saturday at noon for the latest insights. 📞 For expert guidance or a free Home Market Analysis, call Bill Coughlin and the Coughlin Team at 778-374-3744—we’re here to help you make the right move.
Fraser Valley December 2025:
The Fraser Valley market continued to cool in December 2025, but the pace of decline slowed sharply. About 33% of single-family homes lost value, with average prices down $7,120. That is a major improvement from November’s much steeper $32,659 drop.
Sales remained slow due to affordability challenges, economic uncertainty, and high inventory, keeping buyers firmly in control. While conditions are still soft, the smaller price adjustment suggests the market may be starting to stabilize compared to late fall. Bottom line: prices are correcting at a slower rate, buyers still have leverage, and the Fraser Valley is holding up better than Metro Vancouver.
Condos faced an even more challenging month, with 75% losing value and average prices dropping by $5,257. Townhome values were unchanged, posting the same $5,805 decline as in December. With trade negotiations and tariff concerns still in the spotlight, prices for condos and townhouses, we are forecasting that these lower prices could help set the stage for a modest rebound in sales in 2026 and stabilizing the market in the next 3 months.
The positive takeaway? Conditions strongly favor buyers right now. Sellers, however, will need a well-planned strategy to achieve the best possible value.
The takeaway? This is a great time for buyers to step in. Sellers, however, need a sharp strategy to secure the best deal.
Wondering which neighbourhoods are gaining momentum—or slowing? Visit VancouverMarketReports.com every Saturday at noon for the latest insights. 📞 For expert guidance or a free Home Market Analysis, call Bill Coughlin and the Coughlin Team at 778-374-3744—we’re here to help you make the right move.
|
We thank Bill Coughlin for their support of these Coquitlam Real Estate Market Updates which include sub-areas such as Coquitlam West, Maillardville, Westwood Plateau, Burke Mountain, Central Coquitlam etc. Contact Bill and the Team as the Local Experts.... more details.
Download the full Coquitlam.Marketupdatereport.PDF
This Coquitlam Real Estate Market update includes the sub areas Westwood Plateau, Coquitlam West, Burke Mountain, Central Coquitlam, Maillardville etc.

Click Image to compare previous STR/ MTI graphs
Trying to do the math? Lessons: STR MTI
| |
|
|
|
|
|
Hello Friends, It’s Bill Coughlin!
Have these Market Reports helped you?
💰 I’ve spent over $500,000 and 42 years creating the most accurate Real Estate Forecasts for Fraser Valley & Vancouver!
✅ If you find value in these reports — TEXT ME to let me know you want them to continue!
❓Need help understanding what this means for your property?
📞 Call me for your Free Market Analysis of your home.
📲 Text me now at 778-374-3744. I’m here to help put More Money in Your Pocket!
|
Coquitlam Market Reports and Forecasts
Real Estate Market Analysis Reports
|
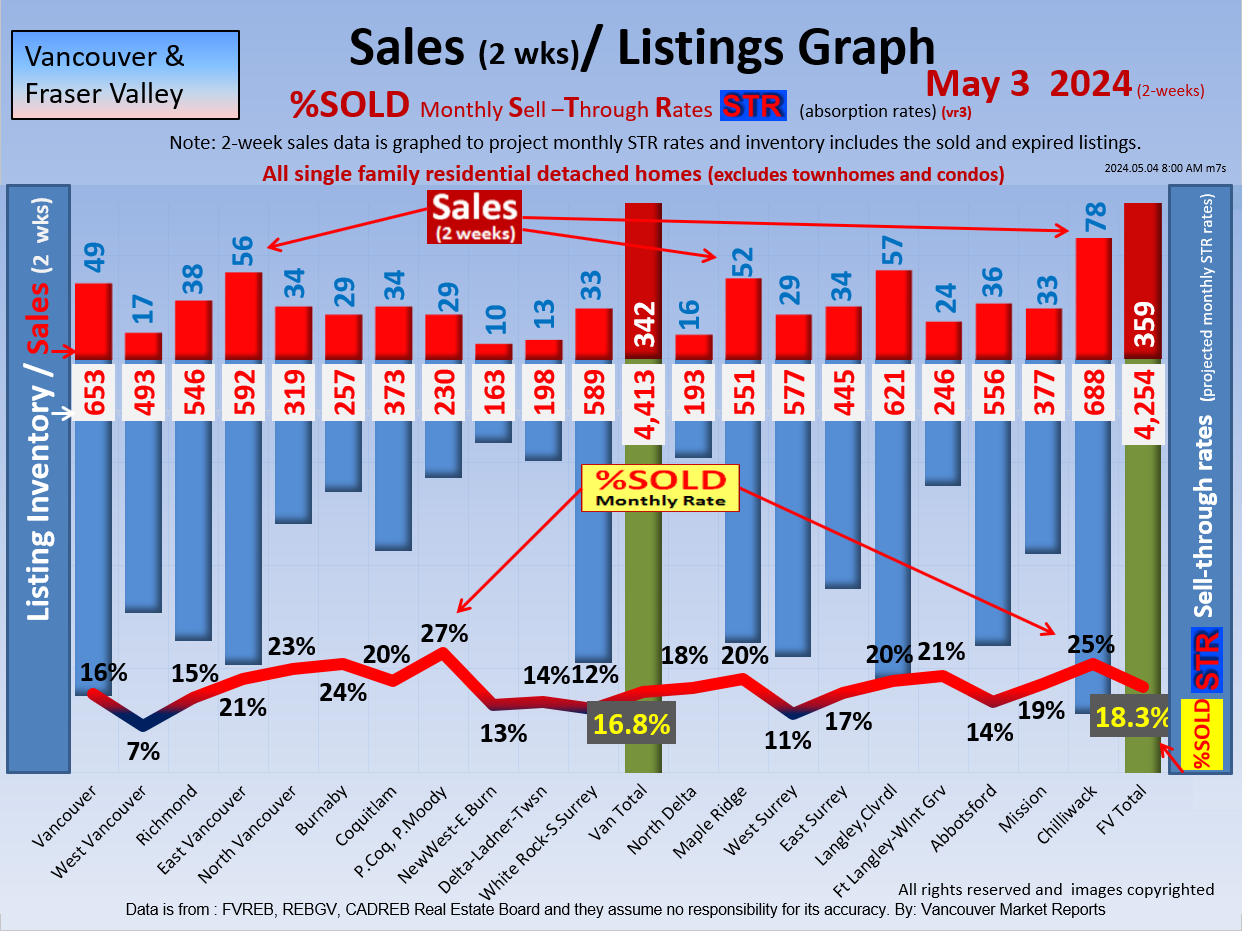
This is the most accurate %SOLD-Monthly Sell Through Rates (STR Graph) using a 4 week time period to analysis the housing prices and Market trends. This Market Report is derived from the exact Sat to Friday 4 week time periods and this is dramatically more accurate than the month to month comparisons that vary based on actual working days eg month, weekends. These trends enable Real Estate Market predictions and forecast outlooks. |
Disclaimer: Market predictions are exactly that: predictions. Market conditions are changing daily and you should consult with your local expert to confirm facts before making any decisions.
Archives July 2011-Feb 1 2012
|
Registration for Monthly and Bi-Monthly Market Reports

|
Vancouver and FV Market Reports and Forecasts
Developers, Investors, Realtors or Financial Advisers.
- Now you can be informed of the market changes as they happen.
- Now you can receive bi-monthly updates.=
- Each month we analyze the Real Estate Supply and Demand for 22 cities in the lower mainland: Vancouver to Chilliwack and we make the forecasts for the following month or more.
Membership Free, (Sponsored Realtors Click here )
This is a free service to over 5 million viewers today!!! (
|
|
|
|
Hot New Listings
Coquitlam's
Instant MLS Search
Coquitlam Homes
for Sale
- Today's New Listings
- $1,000,000 or Less
- $1,000,000 - $1,250,000
- $1,250,000 - $1,350,000
- $1,350,000 - $1,500,000
- $1,500,000 - $1,750,000
- $1,750,000 - $2,250,000
- $2,250,000 - $2,750,000
- $2,750,000 and More
- Coquitlam Foreclosures
Coquitlam
Condos for Sale
- Today's New Listings
- $400,000 or Less
- $400,000 - $475,000
- $475,000 - $500,000
- $500,000 - $550,000
- $550,000 - $600,000
- $600,000 - $650,000
- $650,000 - $700,000
- $700,000 - $850,000
- $850,000 and More
- Condo Foreclosures
Coquitlam
Townhouses
Coquitlam
Building Lots
Coquitlam
Farms
|
|